


A utility can get a rate case approved faster than it can get a transformer delivered.
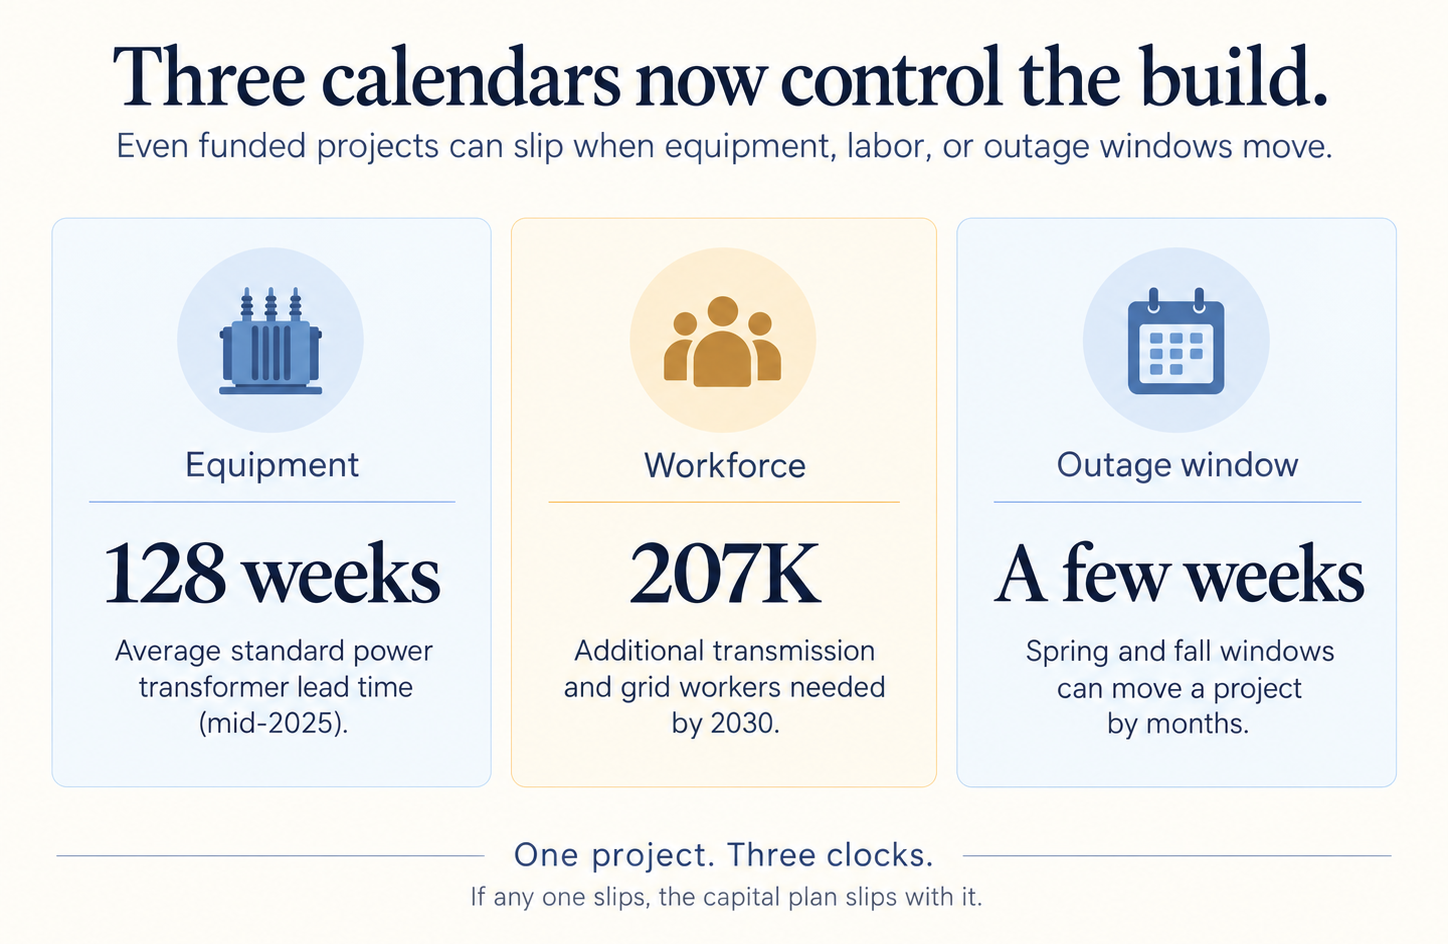
That sentence should worry every transmission executive in the country. A standard power transformer averaged about 128 weeks to ship in mid-2025 (IndustrialSage). For the largest units, PwC analysts put lead times at up to four years (pv magazine USA). The capital plan says the substation energizes in 2027. The vendor’s factory says otherwise.
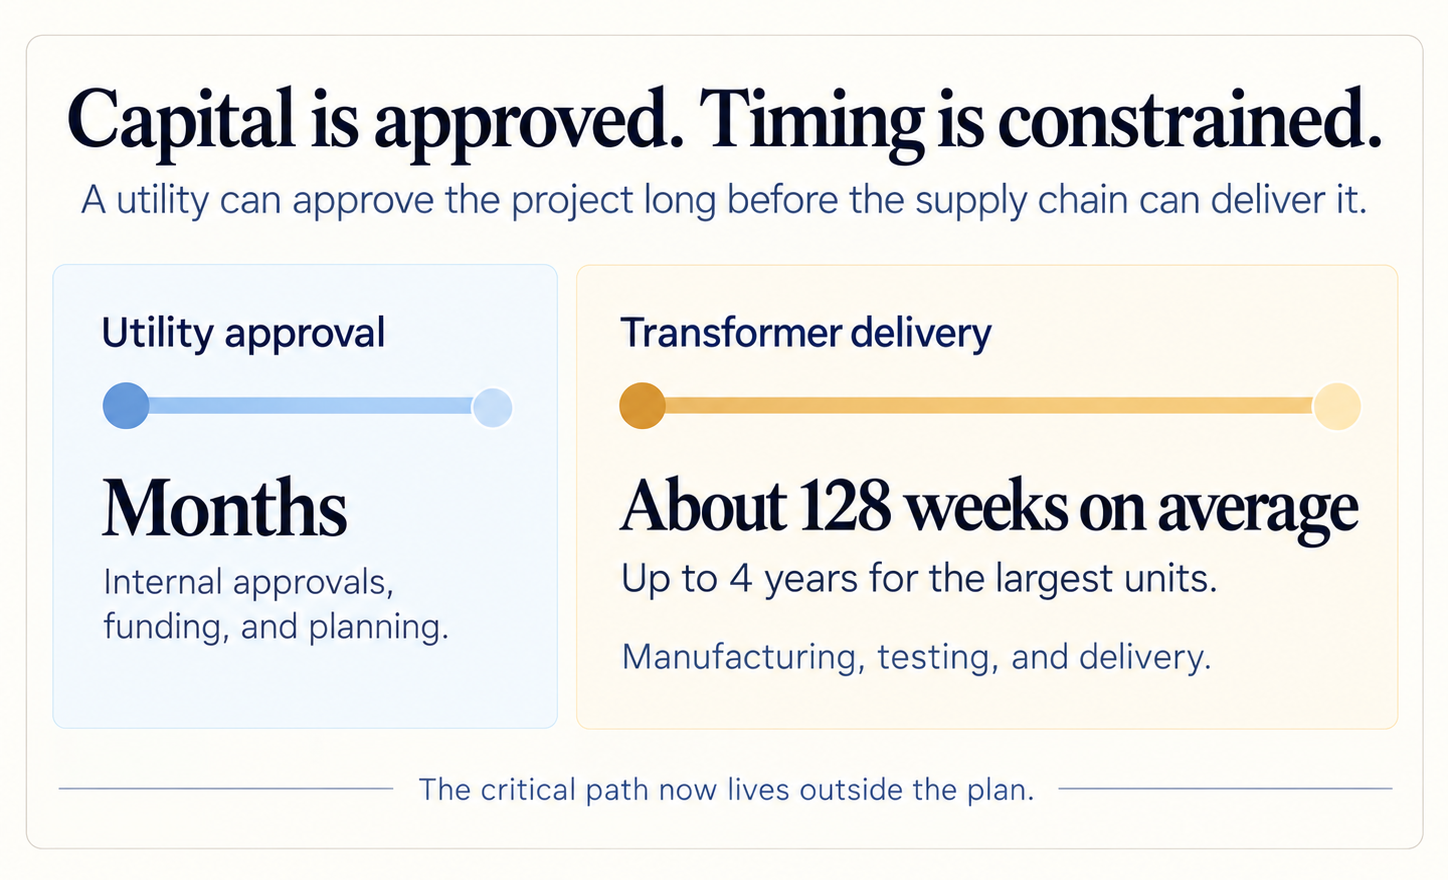 In our last post we called this the rearview grid: plans built on information that describes what already happened. Nowhere is that more expensive than in the grid supply chain, where the first sign of trouble usually arrives as a missed ship date.
Texas shows how fast demand can outrun the grid
Texas shows the gap clearly. The state added 391,243 residents in 2025, more than any other state (Governing). On top of that growth sits a wave of data center requests. In September, ERCOT provisionally sorted nearly 500 GW of large-load projects, a total more than five times the grid’s record peak demand, and excluded 302 GW of them from its first study (ERCOT).
Nobody agrees on how much of that demand is real. ERCOT’s preliminary forecast in April showed peak demand more than quadrupling by 2032, and ERCOT’s own CEO said the number was likely too high (Utility Dive). Then in August, a directive from the governor paused energization approvals for large data center and crypto loads until every project is verified (ERCOT).
Meanwhile, the wires take far longer than the load. Transmission can take five to 10 years or more to plan, permit, and build, while a large load can ask to connect within months or a few years (Data Center Knowledge). Texas is spending to close the gap. ERCOT estimates its 765-kV expansion plan at about $33 billion (ERCOT), and one piece of it, the Eastern Backbone, carries a $9.4 billion price tag on its own (Energy Capital). Every one of those lines needs transformers.
The transformer shortage put the critical path in someone else’s factory
The demand curve is steep. Wood Mackenzie found that demand for generator step-up transformers rose 274% from 2019 to 2025, and demand for substation transformers rose 116%. Prices climbed roughly 80% over five years (pv magazine USA). Wood Mackenzie also estimated a 30% supply shortfall for power transformers in 2025 and 10% for distribution transformers (Wood Mackenzie). BCG reports that demand for the silicon steel inside transformers has tripled since 2015 (BCG).
Relief is coming, but not soon. Hitachi Energy is investing $1 billion in U.S. capacity, including a $457 million large power transformer plant in Virginia with first shipments planned for 2028 (Transformers Magazine), and Siemens Energy has committed to a large power transformer factory in Charlotte. Every project scheduled between now and then lives with the market as it is. CoBank’s July 2026 review found demand for critical grid materials still outstripping supply (National Law Review).
The supply base is narrow, too. Cleveland-Cliffs’ Butler Works mill in Pennsylvania is the only U.S. source of grain-oriented electrical steel, the material inside every transformer core (The Breakthrough Institute). About 80% of electrical transformers are made abroad, according to the Niskanen Center (Manufacturing Dive).
Transformers are only the most visible item. Switchgear, breakers, conductor, and cable are on the same list.
What a month of delay actually costs
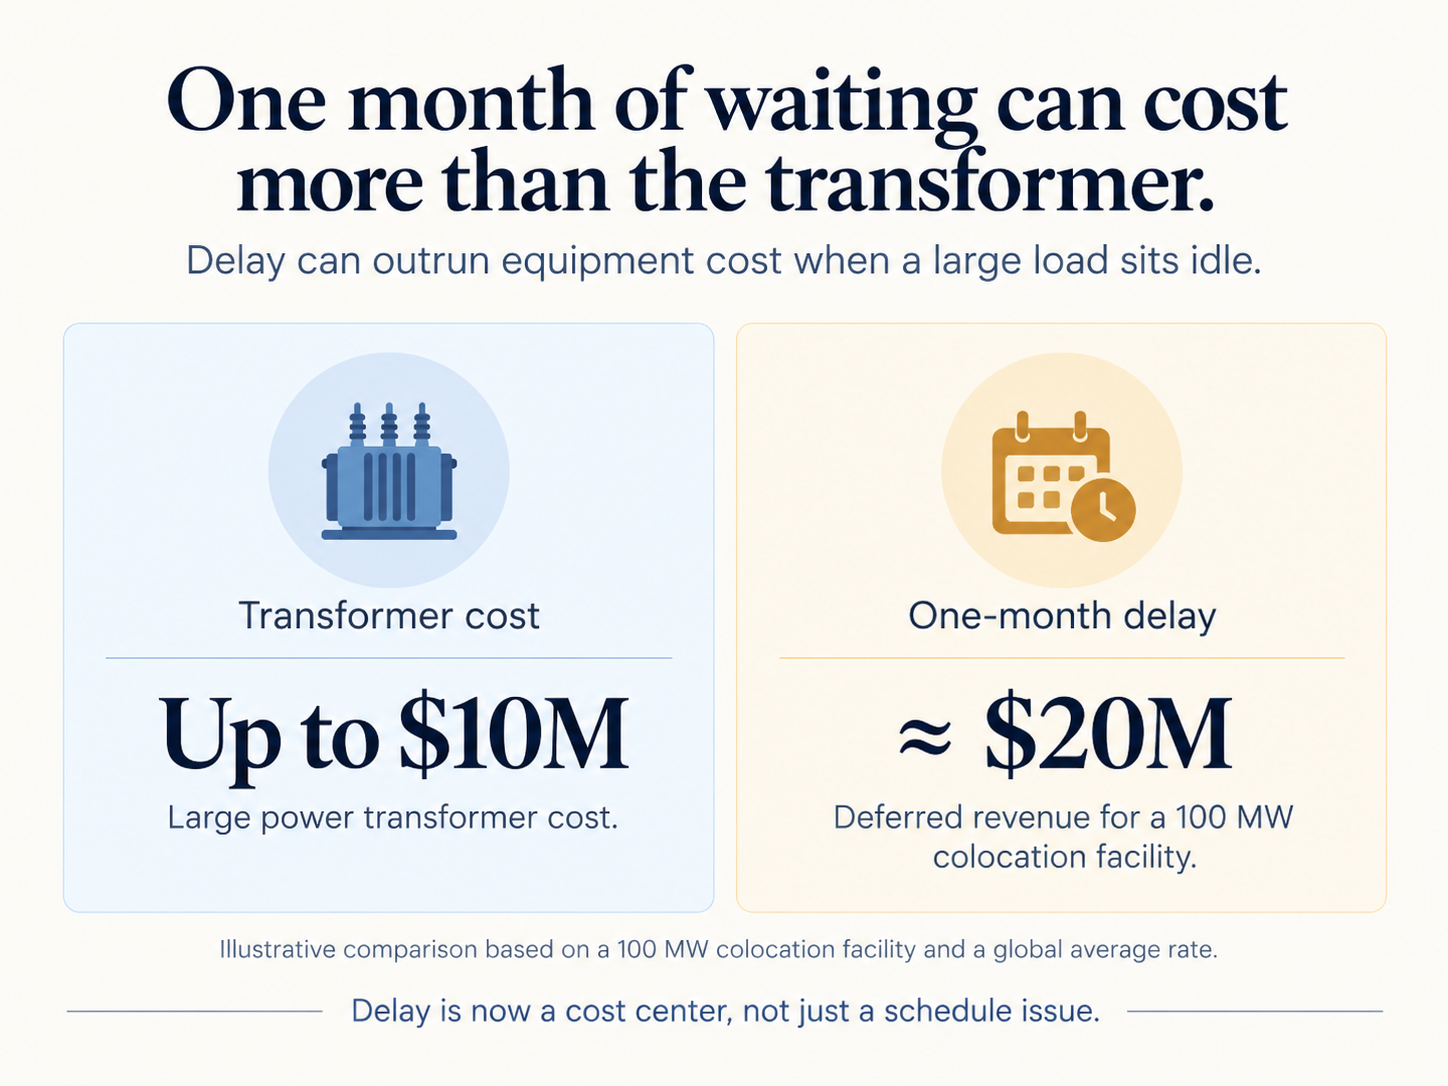
A large power transformer can cost up to $10 million, plus hundreds of thousands of dollars to move, according to utilities surveyed by federal auditors (GAO). The customer waiting on it can lose far more. At colocation rates of about $2.6 million per megawatt per year (Avanza Energy), a 100 MW colocation facility that can’t energize defers roughly $20 million in revenue every month. That rate is a global average, so the exact figure varies by market, but the scale holds: for the customer, one month of waiting can cost more than the transformer. And a customer facing that math can take its project, and the load and collateral that come with it, to whichever utility can serve it first.
 The numbers get bigger on the transmission side. Grid Strategies found that every year of delay on $1 billion of well-planned transmission costs consumers $150 million to $370 million in lost net benefits (Grid Strategies). The same study estimated that a one-year delay on Texas’s CREZ lines would have cost $6.3 billion, and that a two-year delay on one New England line added more than $500 million to a $1.5 billion project (S&P Global).
That is why capital is the easy part. The equipment, crews, and outage windows that money buys arrive on someone else’s schedule, often years later, and every month between the commitment and the delivery carries a cost.
The grid workforce shortage is the second bottleneck
Equipment that arrives on time still needs people to install it. Goldman Sachs Research estimates the U.S. needs about 207,000 additional transmission and grid workers by 2030. In 2024, 59% of utility employers said they had trouble hiring line workers, and about one in five electricians is 55 or older (EnergyNow).
Data centers are making it worse. Urgent hyperscale projects are paying significantly more for electricians, and the hottest labor markets (the Carolinas, Georgia, Virginia) overlap with some of the biggest grid build programs. When the contractor you planned on wins a better-paying job down the road, you find out at mobilization.
Then there are outage windows. Much transmission work can only happen when a line is switched off, usually in short spring and fall windows. Every project on a system competes for the same few weeks. Miss one and the schedule slides by months.
What leading utilities are doing about grid supply chain risk
The best utilities treat procurement as a competitive weapon (POWER). They order transformers and switchgear before projects clear final approval. They sign multiyear supply agreements. They standardize designs so one order can serve many projects. They bundle work so the best contractors stay with them year after year. And they squeeze more out of existing corridors with advanced conductors and dynamic line ratings.
All of those moves are smart, and each one is a bet on a specific vendor or contractor.
Early commitments concentrate risk
Ordering early concentrates risk. Once you have committed to a manufacturer’s 2028 production slot, that company’s health is your schedule. Bundling work with one contractor means that contractor’s safety record, finances, and backlog are now your critical path.
Concentration runs the other way, too. When a few hundred large-load projects drive most of a forecast, each one is a bet. A substation built for a data center campus that never arrives ties up a transformer, a crew, and an outage window that another project needed. And as Texas showed in August, one policy decision can freeze a whole class of customers at once.
Most utilities check a vendor’s health at contract award and again when something goes wrong. In between, they rely on the vendor’s own status reports. That is the rearview grid again.
Six early-warning signs of supplier risk
The signals that a vendor or contractor is in trouble almost always show up in public first:
- A credit rating downgrade, a delayed earnings filing, or a new lender
- A fire, an outage, or a safety citation at a key plant
- A strike, a layoff, or a hiring freeze
- A change of ownership, or the loss of a large customer
- A big new order from a hyperscaler buying the same units you need
- Tariff, trade, and commodity moves that hit a Tier 2 supplier of steel, copper, or bushings
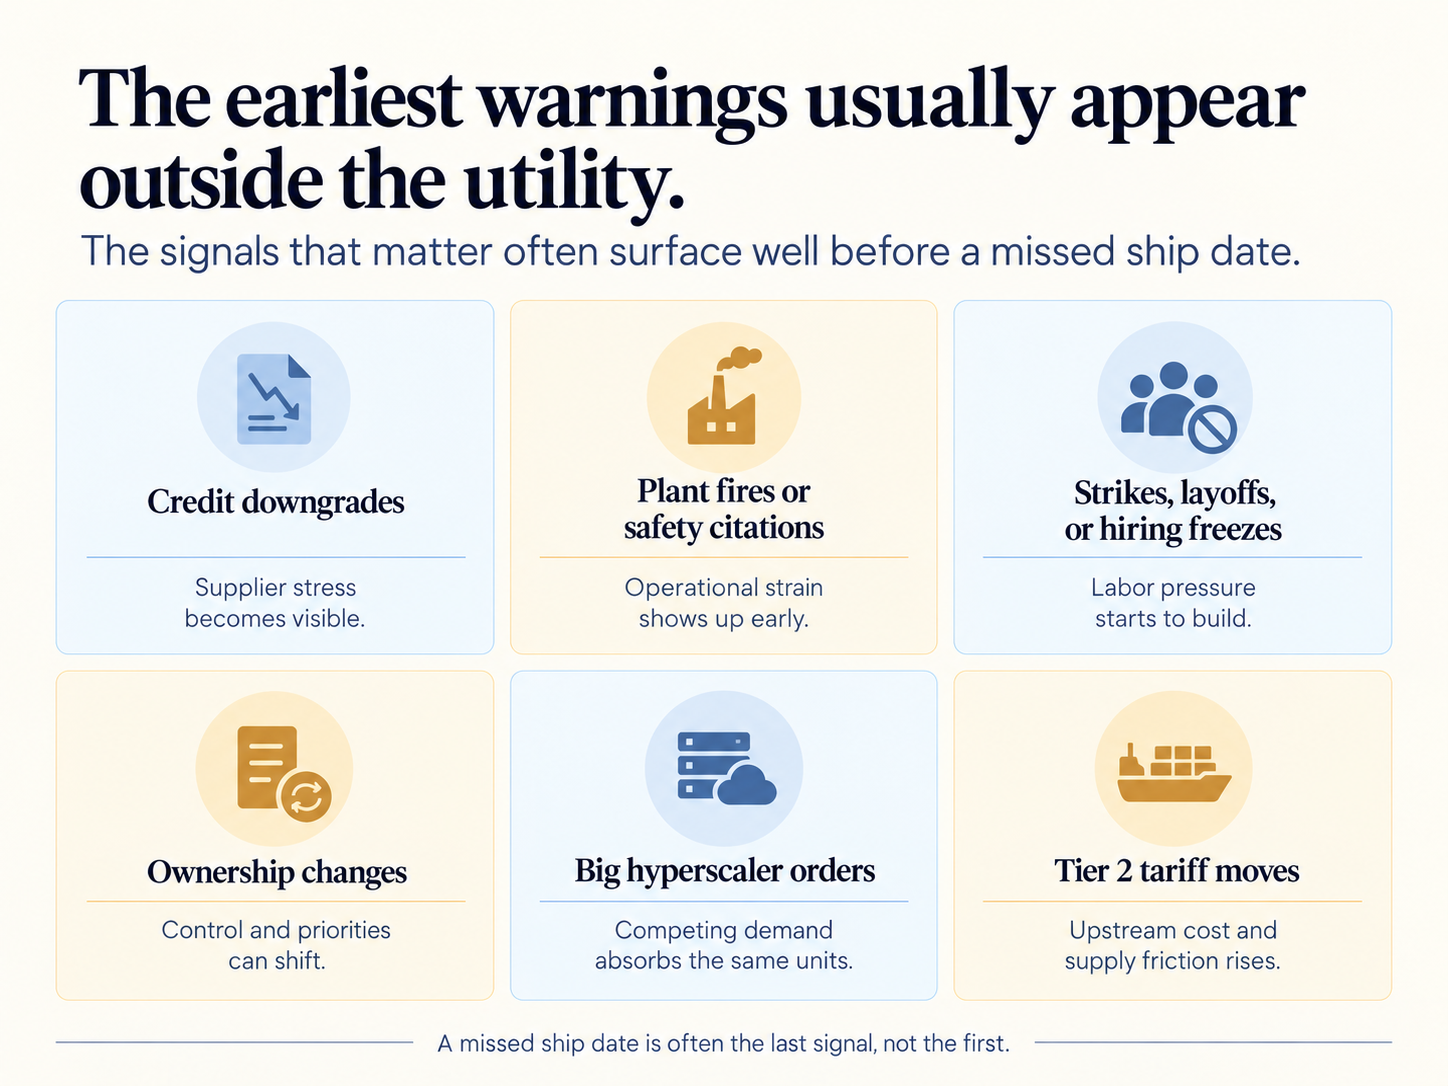 Any one of these might mean nothing. Three of them in the same quarter, at the company building your transformers, means something.
The customers on your plan send signals too. Collateral postings, interconnection classifications, developer financing, and county permitting votes can show which large loads are moving and which are stalling, well before a utility commits equipment to them.
How Polaris I/O monitors supplier and contractor risk
Polaris I/O watches the vendors, contractors, and large-load customers on your plan, and the suppliers behind them, continuously. Signal Monitoring tracks meaningful change across each one. The Pattern Engine connects signals that look minor on their own into patterns that matter. Decision Activation ties each alert to the specific projects, orders, and outage windows it touches and routes it to the procurement or project lead who can act. Signal. Outcome. Speed.
We have done this in other supply chains where the stakes were just as real. For a global consumer brand, Polaris I/O flagged a supplier’s credit rating downgrade ahead of the supplier’s bankruptcy filing. For another client, we surfaced port congestion before it appeared in the weekly operations report. In both cases the value was simple: time to act before the problem became a delay.
On the grid, where a single transformer can hold up a substation for years, that time is worth even more. This is the continuous margin protection we described in part one. Polaris I/O is designed to help you see around corners and reallocate resources while it can still make a difference, before delays erode your margins. You can’t buy your way out of a 128-week lead time. You can see it coming.
Frequently asked questions
How much does a one-month delay on a grid project cost?
There is no single average, because the cost depends on what the project serves. Two benchmarks show the scale. For transmission, Grid Strategies found that each year of delay costs consumers $150 million to $370 million in lost net benefits per $1 billion invested, which works out to roughly $12 million to $31 million for every month. For a 100 MW colocation data center waiting on power, a month of delay defers roughly $20 million in revenue to its owner. Either way, one month can cost more than the transformer the project is waiting on.
How long are transformer lead times?
Standard power transformers averaged about 128 weeks in mid-2025, and the largest units can take up to four years.
How much does a large power transformer cost?
Utilities report prices of up to $10 million per unit, plus hundreds of thousands of dollars to transport. Prices have climbed roughly 80% in five years, and the largest units can take up to four years to arrive.
What does a month of grid delay cost?
For a 100 MW colocation data center, roughly $20 million a month in deferred revenue to its owner, which can exceed the price of the transformer it is waiting on. For transmission, Grid Strategies estimates $150 million to $370 million in lost consumer benefits per $1 billion of investment for each year of delay.
What causes the transformer shortage?
Demand from data centers, renewables, and grid replacement has outpaced factory capacity, and key materials such as grain-oriented electrical steel and copper are constrained.
How can utilities reduce grid supply chain risk?
Order early, standardize designs, sign multiyear agreements, and monitor the financial and operational health of every critical vendor and contractor continuously, not just at contract award.
How does monitoring signals reduce grid delays?
Problems at vendors, contractors, and large-load customers often show up in public signals before they reach a status report. A decision intelligence platform like Polaris I/O watches those signals continuously and routes each one to the team that can act, while there is still time to reorder, resequence, or switch suppliers.

Related Posts
Nothing found.