


Utilities have the money. What they don’t have is warning.
America is about to rebuild its grid. Investor-owned utilities plan to spend more than $1.1 trillion from 2025 through 2029, almost as much as they spent in the entire previous decade. In just four months, S&P raised its five-year utility capex outlook from $1.169 trillion to $1.295 trillion (National Law Review). BCG counts roughly $6 trillion of U.S. buildout investment across power, data centers, and electrification over the same five years, about three times the prior five (BCG).
BCG’s verdict on all that money: “capital is the easy part.”
The hard part is knowing what is about to happen before it happens.
How utility capital planning works today
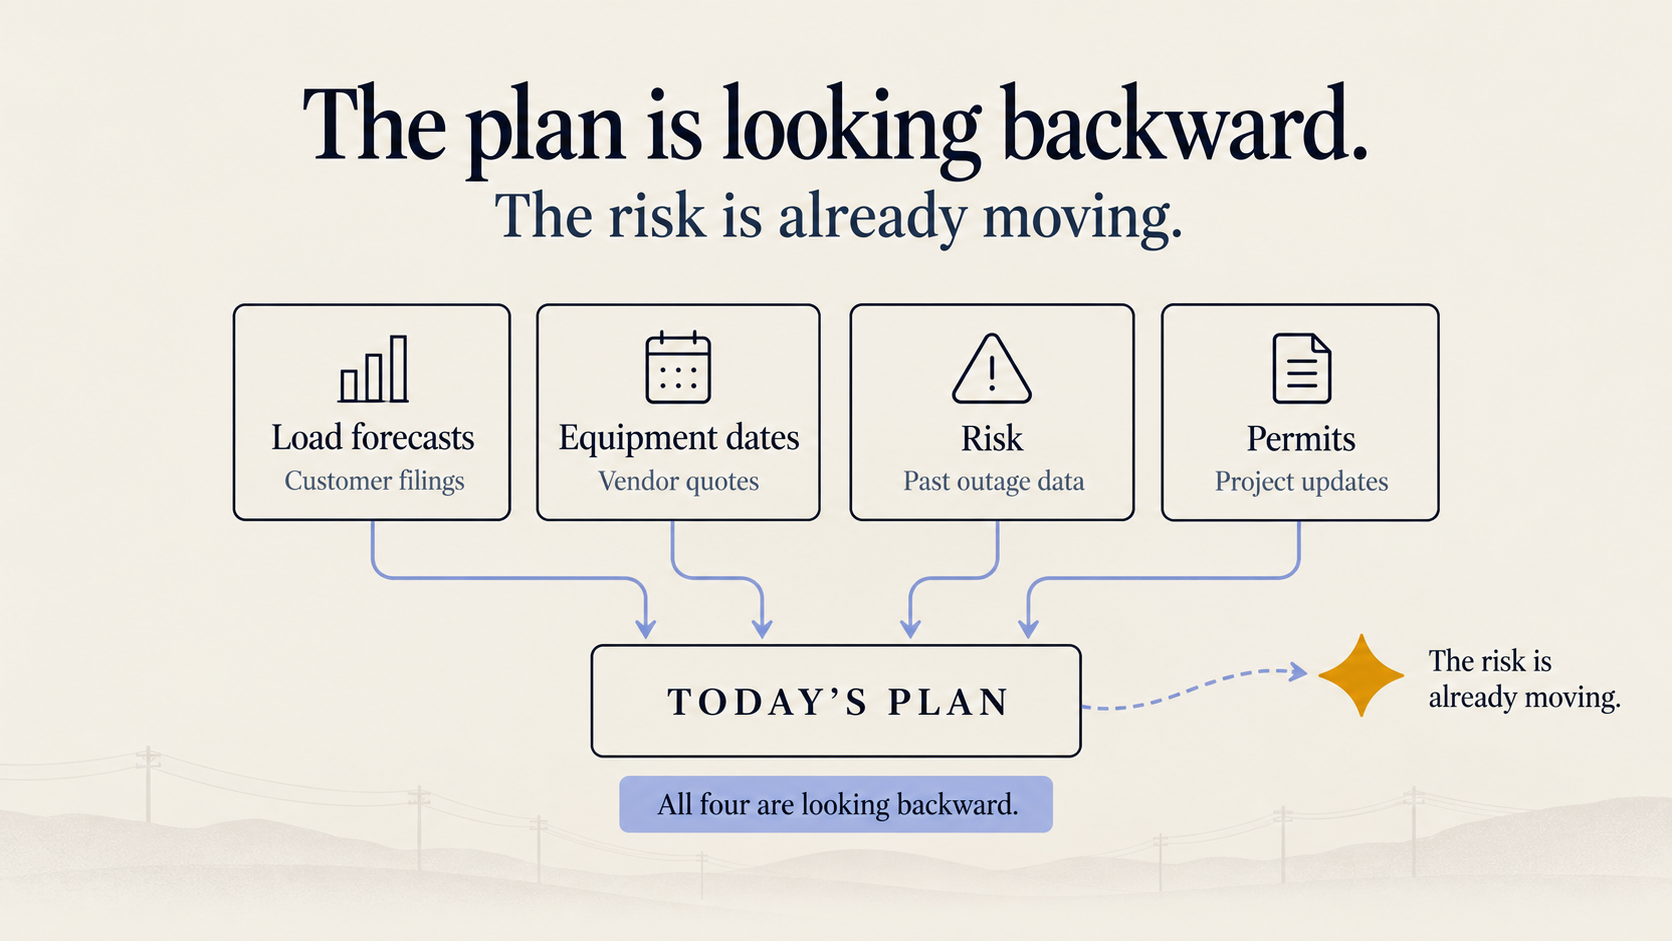
Load forecasts come from customer filings. Equipment dates come from vendor quotes. Risk comes from last season’s outage data. Permit status comes from the project team’s weekly update.
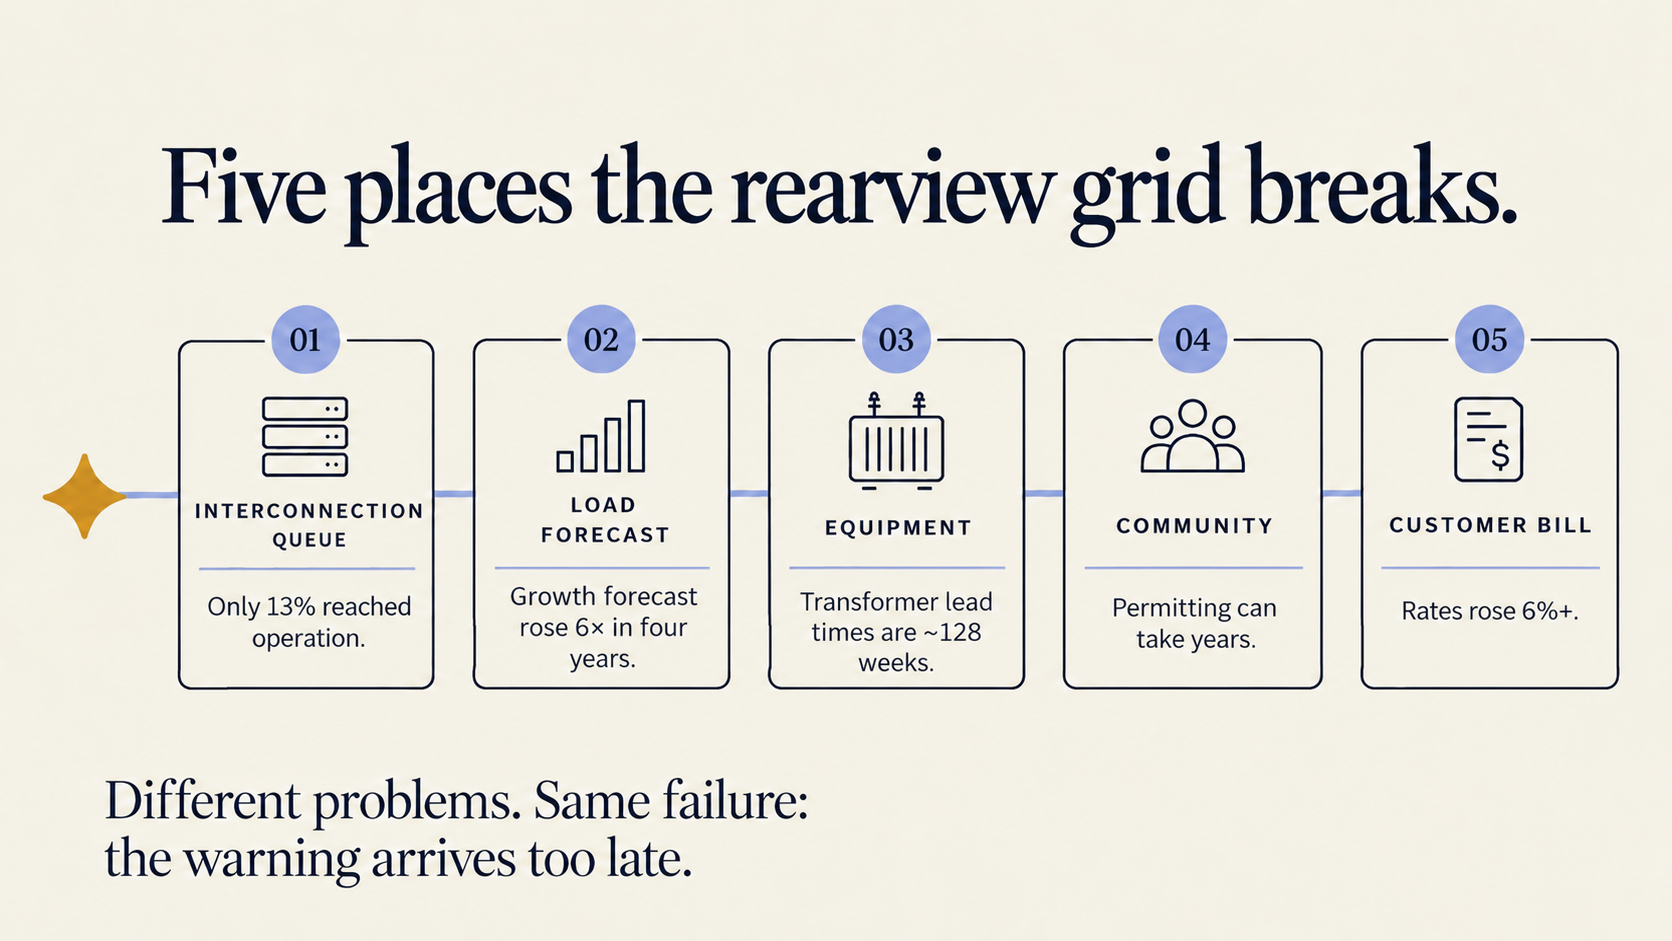
Every one of those inputs is a record of something that already happened. By the time it lands in the planning model, the cheap fix is gone. That is the rearview grid. Right now it is breaking in five places at once.
 Five places the rearview grid breaks
- The interconnection queue: most of the plan never gets built. Only 13% of the generating capacity that asked to connect to the grid from 2000 through 2020 reached commercial operation by the end of 2025. Three quarters walked away, and projects built in 2025 waited a median of more than five years (Lawrence Berkeley National Laboratory). More than 750 GW withdrew in 2025 alone, and 2,061 GW is still in line (LBNL). BCG puts the withdrawal rate at about 78% and argues grid operators need to show “where capacity will be, not just where it is today” (BCG).
- The load forecast: nobody agrees on what is coming. The five-year U.S. load growth forecast rose sixfold in four years. Utility filings imply about 90 GW of new data center load by 2030 while market analysts see closer to 65 GW, and no public utility forecast tracks AI load on its own (Grid Strategies). McKinsey expects U.S. data centers to add about 460 TWh of demand from 2023 to 2030 (McKinsey), and finds that time to power is now the top factor in where data centers get built (McKinsey).
- The equipment: the calendar belongs to your vendors. A standard power transformer took about 128 weeks to ship in mid-2025 (IndustrialSage). Wood Mackenzie estimated a 30% supply shortfall for power transformers and 10% for distribution transformers that year (Wood Mackenzie). You can get a rate case approved faster than you can get a transformer delivered.
- The community: the calendar belongs to your neighbors, too. A federal environmental impact statement takes a median of about 3.5 years. One 290-mile line between Idaho and Oregon waited nine years for its federal review. The Grain Belt Express, proposed in 2010, spent more than a decade fighting state lawmakers, even after regulators approved it.
- The bill: customers are running out of patience. Electric rates rose more than 6% nationally from December 2024 to December 2025 (Pew). Utilities asked for a record $31 billion in rate increases in 2025 (Corinex). “We didn’t see it coming” will not survive a rate case.
 The cost of being wrong is margin
For utilities, developers, engineering firms, and investors, stale assumptions turn straight into margin leakage. A project that drifts even a few months off plan starts losing value to contractor escalation, idle crews and equipment, expedited procurement, change orders, and financing carry. Liquidated damages and missed commercial milestones can follow.
What looked like an attractive return at sanction can erode quickly once the schedule and the budget stop matching reality.
The bigger risk is stranded capital. A substation, transmission upgrade, generation asset, or data center interconnection can be planned around a demand forecast, customer commitment, or development schedule that changes before the asset is finished. When load moves, permits slip, supply chains tighten, or a customer delays or cancels, billions of dollars can end up underused, late, or stranded.
Operators feel that as lower returns and thinner project margins. For investors, it means capital tied to last year’s assumptions after the market has already moved on.
More data won’t fix this on its own. Utilities need earlier warning of which assumptions are changing, how those changes run through project economics, and which intervention preserves the most value.
The signal was there. It just wasn’t inside the utility.
None of the five breaks above were really surprises. A transformer vendor in trouble shows up in credit markets, plant incidents, and hiring freezes months before it misses a ship date. A data center that will never be built shows up in stalled zoning votes, withdrawn tax incentives, and quiet land sales. A queued wind or solar project that will withdraw shows up in its developer’s financing news. A route that will draw a lawsuit shows up in county meeting agendas long before the public hearing.
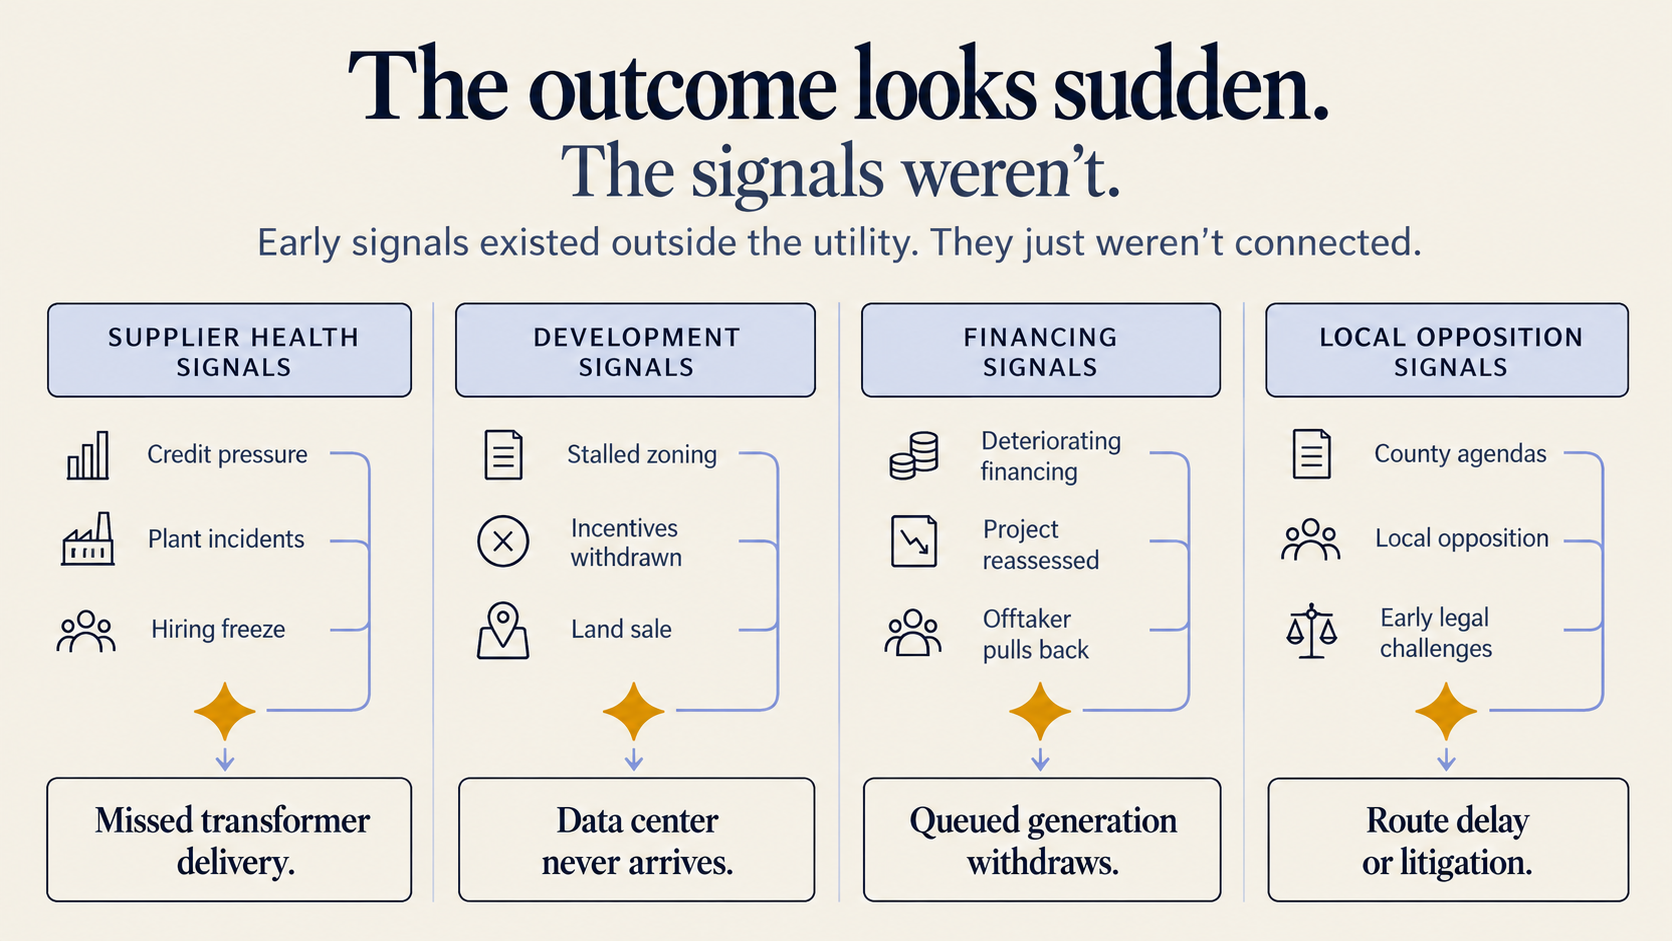 The information exists. It is public, scattered, and moving fast. Utilities just aren’t set up to see it.
What leading utilities will do differently
The utilities that do best in this cycle will be the ones that see first. They will lock the right vendor before the shortage, screen out the speculative load request before building for it, engage the landowner coalition before it forms, and stage the crew before the storm.
The plan they already have just needs a new input: an outside-in view of the world it depends on.
How Polaris I/O helps utilities see first
Polaris I/O is a decision intelligence platform. Our Signal Monitoring continuously watches the suppliers, contractors, large-load customers, developers, communities, and physical risks behind a utility’s plan. Our Pattern Engine connects signals that look minor on their own into patterns that matter.
We already do this in supply chain risk, where early warning on supplier health and logistics has given clients time to act before a problem became a delay. On the grid, lead times are longer and the stakes are higher, which makes early warning worth even more.
Continuous margin protection: turning warning into action
Seeing a change early only pays off if someone acts on it. Polaris I/O evaluates a utility’s internal project, operational, and commercial data alongside those outside signals. It estimates the likely financial and schedule impact of what it finds and recommends the decisions most likely to protect value. Decision Activation ties each recommendation to the projects and assets it affects and routes it to the team that can act.
That might mean accelerating one investment and deferring another, resequencing construction, redirecting procurement, prioritizing an interconnection, or renegotiating a commitment before a developing risk turns into a realized loss.
Instead of stopping at “What is happening?” Polaris I/O helps decision-makers work through the questions that come after it:
- What is likely to happen next?
- Which projects, contracts, or margins are exposed?
- What does it cost us if we do nothing?
- Which action best protects our return, and when does it need to happen?
We call the result continuous margin protection. Operators act on a risk while there is still time to change the outcome, so contract economics and capital returns hold up through the build. Signal. Outcome. Speed.
A trillion-dollar build deserves better than a rearview mirror. Nothing should get by you.
Frequently asked questions
What is the rearview grid?
It is our name for utility capital planning that relies on lagging inputs such as filed load forecasts, vendor quotes, and past outage data, instead of forward-looking signals from outside the utility.
Why do utility capital plans miss?
Most plan risk sits with outside parties: vendors, contractors, large-load customers, developers, and communities. Their problems show up in public signals months before they reach internal reports.
What is continuous margin protection?
It is acting on emerging project and capital risk early enough to protect margins and returns. Polaris I/O does this by connecting outside signals to a utility’s own project and commercial data and recommending the response that preserves the most value.
What is a decision intelligence platform?
A decision intelligence platform like Polaris I/O continuously monitors external signals, connects them into patterns, and turns them into prioritized, explainable actions inside existing workflows.
See how Polaris I/O monitors the signals behind your capital plan. Schedule a demo.

Related Posts
Nothing found.